diabetesデータセットを使ってBottomUpParceLiNGAM/CAM-UVで因果探索をやってみたメモです。
LiNGAMチュートリアル

BottomUpParceLiNGAM — LiNGAM 1.10.0 documentation
lingam.readthedocs.io

CAM-UV — LiNGAM 1.10.0 documentation
lingam.readthedocs.io
参考

未観測でも因果探索したい!BottomUpParceLiNGAMとCAM-UVの紹介 - Qiita
この記事はNTTコミュニケーションズアドベントカレンダー12日目の記事です。 こちらの記事では、巷で話題の統計的因果探索の手法群を総合的に集めたlingamライブラリの紹介と、実際に利用した例を紹介します。この手法群の元祖かつ代表であるLiNGAMは様々なサイトで紹介されて...
qiita.com
diabetesデータセット

load_diabetes
Gallery examples: Model Complexity Influence Gradient Boosting regression Plot individual and voting regression predictions Model-based and sequential feature s...
scikit-learn
内容
準備
# ライブラリインポート
import pandas as pd
import numpy as np

from sklearn.datasets import load_diabetes
from sklearn.preprocessing import StandardScaler

import graphviz
import lingam
from lingam.utils import make_dot, make_prior_knowledge

# データセット読み込み
dataset = load_diabetes(as_frame=True)['data'][['age', 'sex', 'bmi', 'bp']]
dataset['target'] = load_diabetes(as_frame=True)['target']
dataset.head()
       age	   sex	   bmi	   bp	target
0	0.038076	0.050680	0.061696	0.021872	151.0
1	-0.001882	-0.044642	-0.051474	-0.026328	75.0
2	0.085299	0.050680	0.044451	-0.005671	141.0
3	-0.089063	-0.044642	-0.011595	-0.036656	206.0
4	0.005383	-0.044642	-0.036385	0.021872	135.0
BottomUpParceLiNGAMで因果探索
BottomUpParceLiNGAMでは、未観測共通原因を考慮して因果探索ができます。未観測共通原因を有する変数ペアは、両矢印↔で表現されます。文献は以下です。

Just a moment...
direct.mit.edu

ParceLiNGAM: A causal ordering method robust against latent confounders
We consider learning a causal ordering of variables in a linear non-Gaussian acyclic model called LiNGAM. Several existing methods have been shown to consistent...
arxiv.org
# 標準化
scaler = StandardScaler()
Xy = scaler.fit_transform(dataset)

# モデル作成
model = lingam.BottomUpParceLiNGAM(random_state=1)
model.fit(Xy)

# 因果の順番
print(model.causal_order_)

# 隣接行列
print(model.adjacency_matrix_)
[[0, 1, 2, 4], 3]
[[0. nan nan 0. nan]
[ nan 0. nan 0. nan]
[ nan nan 0. 0. nan]
[0.2186471 0.17565042 0.16626303 0. 0.29533368]
[ nan nan nan 0. 0. ]]
# 因果グラフの描画
# 以下よりgraphvizのexeをインストールする。インストール時にpathに追加する。
# https://graphviz.org/download/

dot = make_dot(model.adjacency_matrix_, labels=dataset.columns.to_list())
dot.format = 'png'
dot.render('BottomUpParceLiNGAM')
dot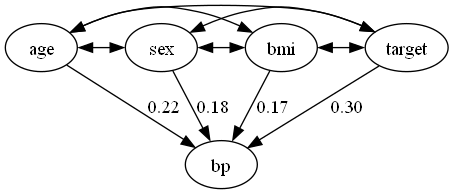
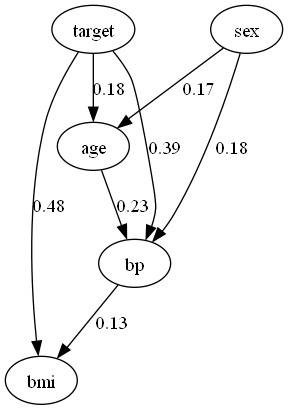
4つの変数について、未観測共通原因を持つモデルが推定されました。説明変数Xについては、diabetesデータセットの一部しか使用していないため、その影響もあるのかもしれません。
時前知識の導入
BottomUpParceLiNGAMでは事前知識を導入することができます。

How to use prior knowledge in BottomUpParceLiNGAM — LiNGAM 1.10.0 documentation
lingam.readthedocs.io
# 事前知識のグラフを描画する関数
def make_prior_knowledge_graph(prior_knowledge_matrix):
    d = graphviz.Digraph(engine='dot')

    labels = [f'x{i}' for i in range(prior_knowledge_matrix.shape[0])]
    for label in labels:
        d.node(label, label)

    dirs = np.where(prior_knowledge_matrix > 0)
    for to, from_ in zip(dirs[0], dirs[1]):
        d.edge(labels[from_], labels[to])

    dirs = np.where(prior_knowledge_matrix < 0)
    for to, from_ in zip(dirs[0], dirs[1]):
        if to != from_:
            d.edge(labels[from_], labels[to], style='dashed')
    return d
# 事前知識の隣接行列を作成
prior_knowledge = make_prior_knowledge(
    n_variables=5,
    sink_variables=[4],
)
print(prior_knowledge)

# 事前知識のグラフを描画
dot = make_prior_knowledge_graph(prior_knowledge)
dot.format = 'png'
dot.render('prior_knowledge')
dot
[[-1 -1 -1 -1 0]
[-1 -1 -1 -1 0]
[-1 -1 -1 -1 0]
[-1 -1 -1 -1 0]
[-1 -1 -1 -1 -1]]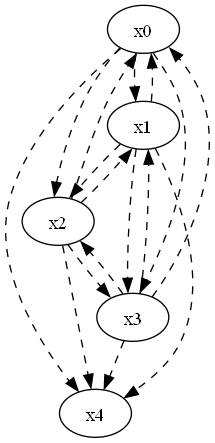
# 標準化
scaler = StandardScaler()
Xy = scaler.fit_transform(dataset)

# モデル作成
model = lingam.BottomUpParceLiNGAM(random_state=1, prior_knowledge=prior_knowledge)
model.fit(Xy)

# 因果の順番
print(model.causal_order_)

# 隣接行列
print(model.adjacency_matrix_)
[[0, 1, 2, 3, 4]]
[[ 0. nan nan nan nan]
[nan 0. nan nan nan]
[nan nan 0. nan nan]
[nan nan nan 0. nan]
[nan nan nan nan 0.]]
dot = make_dot(model.adjacency_matrix_, labels=dataset.columns.to_list())
dot.format = 'png'
dot.render('BottomUpParceLiNGAM_with_prior_knowledge')
dot
事前知識あり
事前知識無し

今回の事前知識の仮定のもとでは、すべての変数ペアが未観測共通原因を持つモデルが推定されました。
CAM-UVで因果探索
CAM-UVでは、非線形かつ未観測共通原因を考慮して、因果探索を行えます。文献は以下です。
Causal additive models with unobserved variables
Causal discovery from data affected by unobserved variables is an important but difficult problem to solve. The effects that unobserved variables have on the re...
proceedings.mlr.press
# 標準化
scaler = StandardScaler()
Xy = scaler.fit_transform(dataset)

# モデル作成
model = lingam.CAMUV()
model.fit(Xy)

# 隣接行列
print(model.adjacency_matrix_)
[[ 0. 0. 0. 1. 0.]
[ 0. 0. nan 0. 0.]
[ 0. nan 0. 1. 1.]
[ 0. 1. 0. 0. 1.]
[ 0. 0. 0. 0. 0.]]
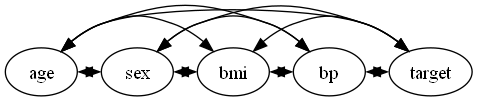
# 因果グラフの描画
dot = make_dot(model.adjacency_matrix_, labels=dataset.columns.to_list())
dot.format = 'png'
dot.render('CAM-UV')
dot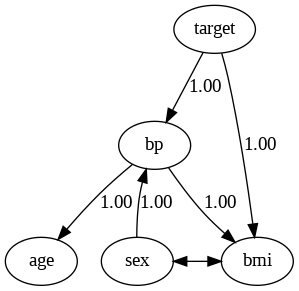

コメント